
- Understanding Amazon Market Basket Analysis Report Structure
- Key Metrics in Amazon Market Basket Analysis Report
- How to Use Amazon Market Basket Analysis for Cross-Selling Success
- Conclusion
The Amazon Market Basket Analysis report is a powerful tool within Amazon Brand Analytics that reveals cross-selling opportunities by showing which products customers frequently buy together. This essential report helps sellers and vendors analyze consumer behavior, optimize PPC campaigns, and develop effective bundling strategies. By understanding purchase combinations, you can maximize revenue per customer and improve your product targeting.
Understanding Amazon Market Basket Analysis Report Structure
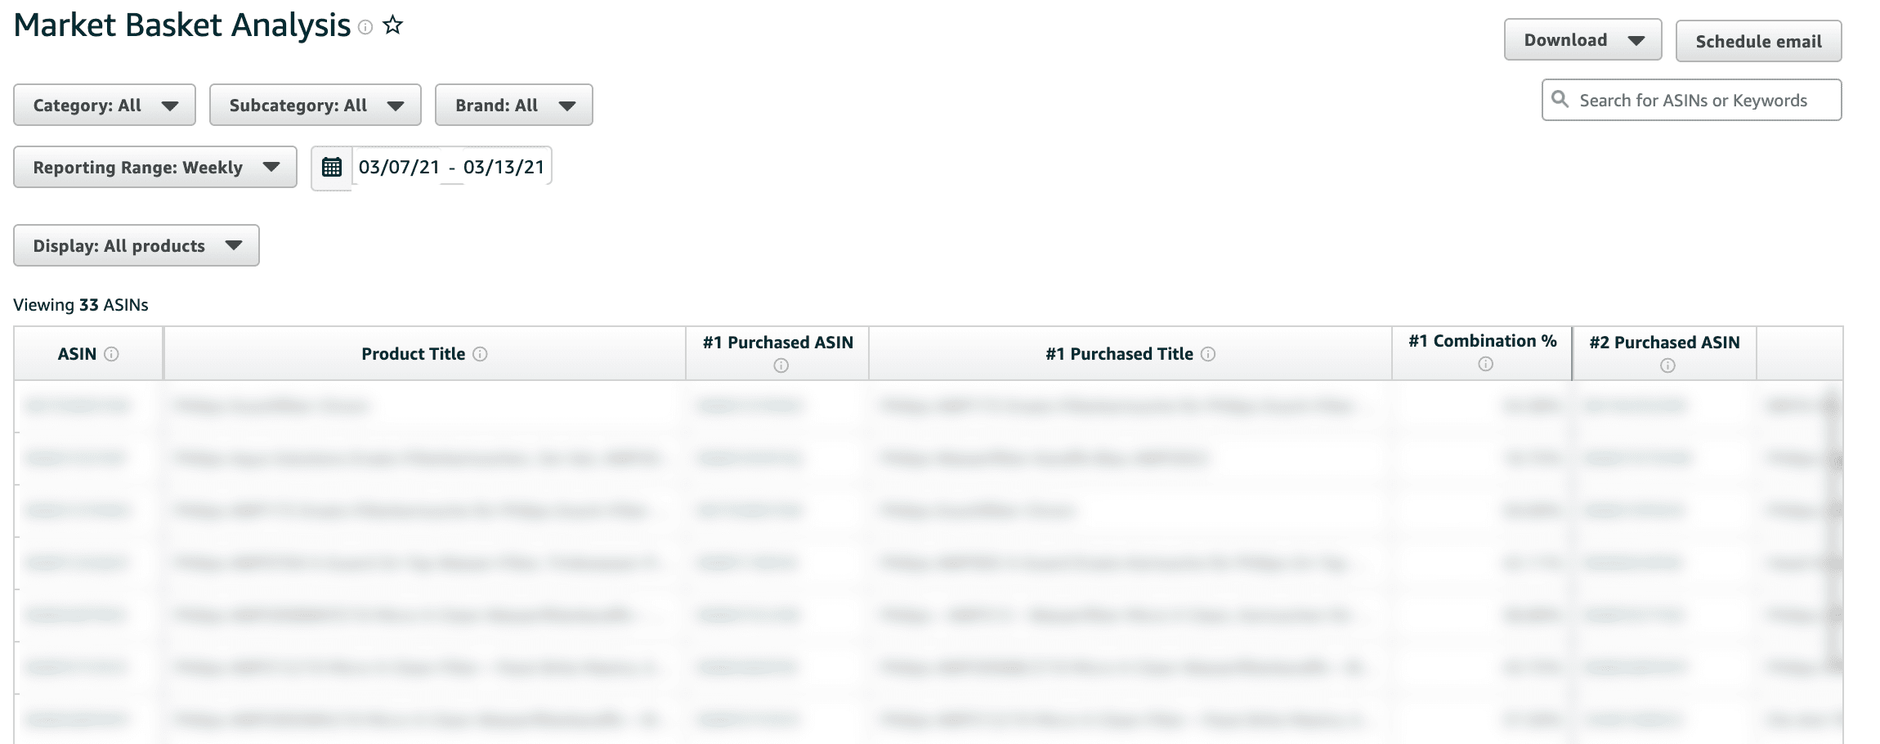
In this report you can first use different filters such as category, subcategory and brand, as well as define a time period. Afterwards, you will be shown a table from which various information can be read out. Within the previously defined time period, you can see three products that were most frequently purchased in combination with your product. The report thus breaks down what else was in your customer's shopping cart at checkout. The report's metrics are explained below.
Key Metrics in Amazon Market Basket Analysis Report
| Key figures | Explanation |
|---|---|
| ASIN | The ASIN is the Amazon Standard Identification Number. The unique identifier is assigned to all products offered on Amazon. |
| Product Title Product Title | The product title is the product name of your product. |
| #1 Purchased ASIN #1 Purchased ASIN | This identifier displays the ASIN of the product that is most frequently purchased with your product. |
| #1 Purchased Title *#1 Purchased Title | The Purchased Title indicates the product name of the product that is most frequently purchased with your product. |
| 1. Combination % #1 Combination % | The percentage indicates the percentage of orders that included both your product and the most frequently purchased product, compared to the total number of orders that included at least two different items, including your product. |
| .... No. 3 Purchased ASIN |
How to Use Amazon Market Basket Analysis for Cross-Selling Success
You can use the Cart Analysis report to identify relationships between products. As a Seller and Vendor, you will learn what a customer buys in addition to your product and the percentage relationship of this joint purchase. If the percentage of the combination is relatively small (e.g. 1%), then it may be a random purchase. Therefore, pay attention to the relationship between the products. It may be that a customer simply searched for different products and bought the two goods together without any connection to your product. A solid percentage guideline for this metric is 10%, but only with attention to critical, content engagement.
Once you've figured out what customers often buy along with your product, you can use that knowledge for combined product offers or cross-marketing. For example, if a customer buys matching filter cartridges with your water filter, you can bundle these ASINs and sell them as a set.
Furthermore, you can use the Market Basket analysis report to optimize your product targeting. For this, you can create a new Sponsored Productscampaign to target in it the products that are frequently bought with your products. This can have the additional effect that if your products are actually bought together more often through PPC campaigns, they will also be seen in the free placements on the product detail page.
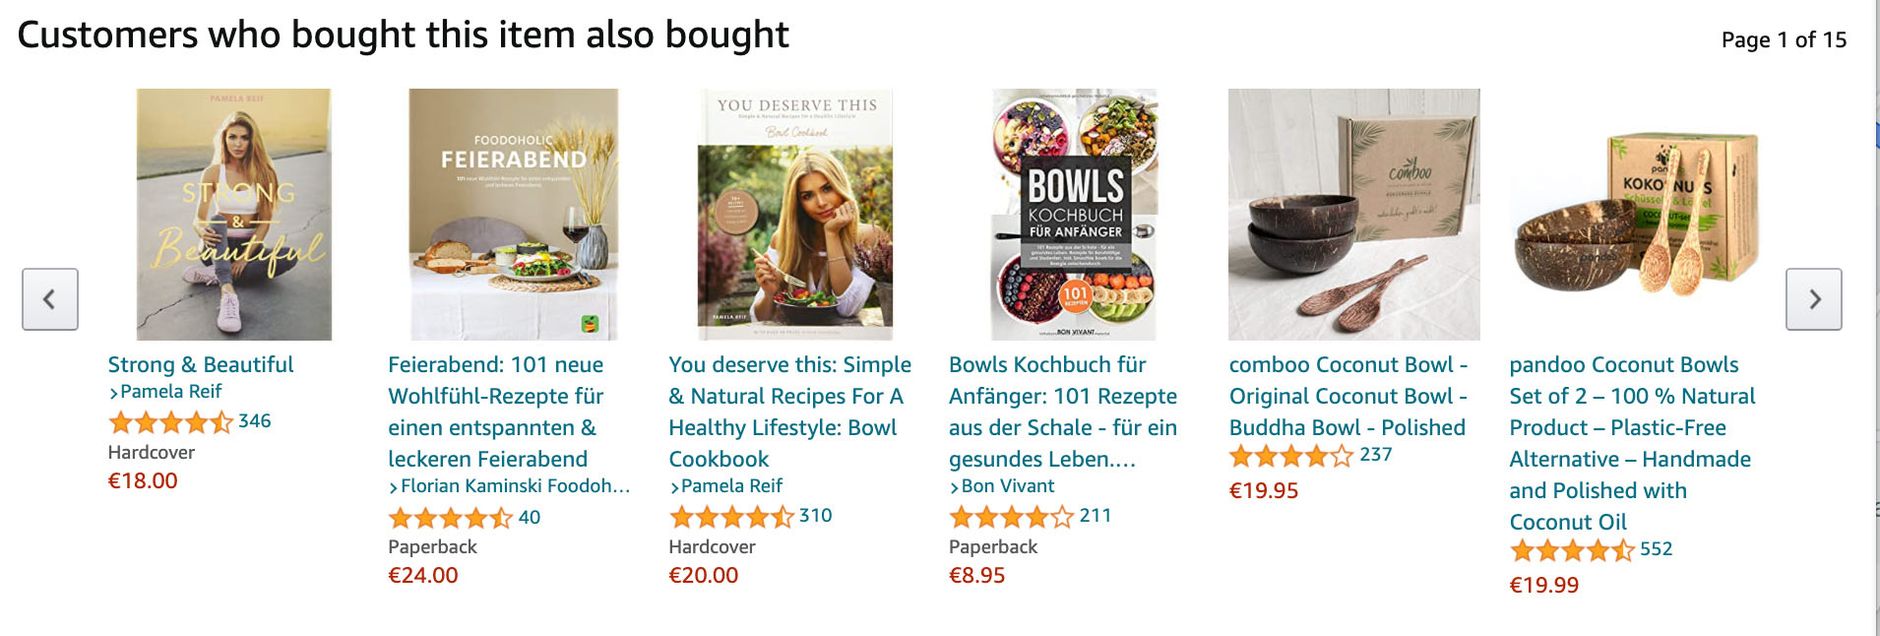
For example, "Customers who bought this item also bought ...":
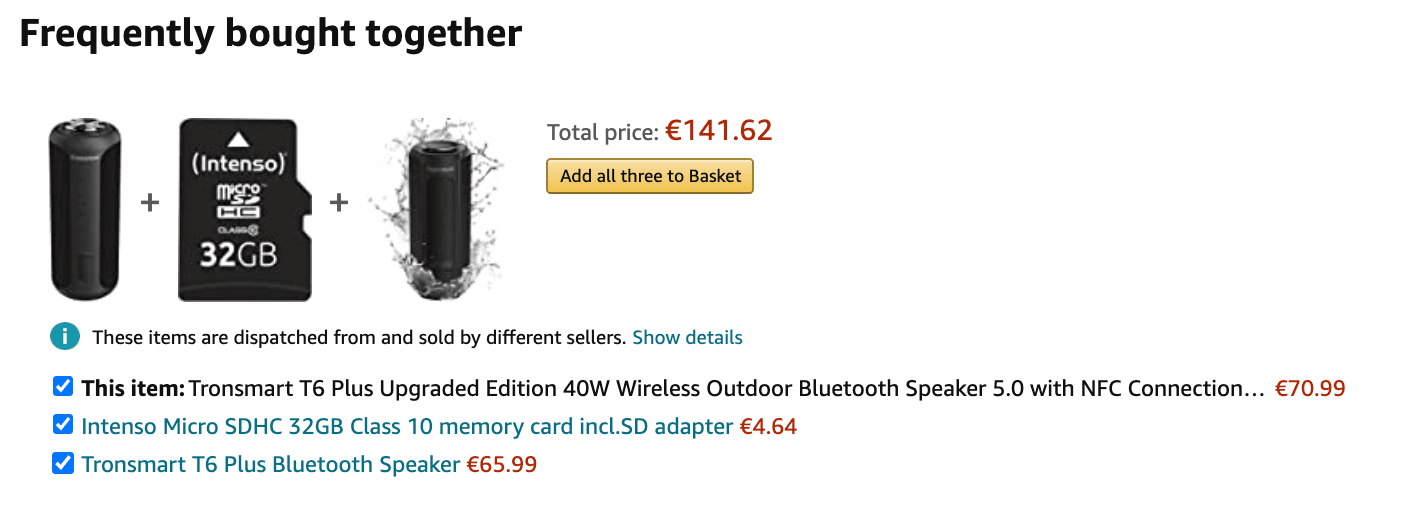
or "Is often bought together with...":
These ads are not sponsored. Amazon decides for itself who is displayed there.
Conclusion
The Amazon Market Basket Analysis report is one of the most valuable tools within Amazon Brand Analytics for maximizing revenue. By effectively leveraging this cross-selling data alongside item comparison insights, you can create targeted bundle offers, optimize PPC campaigns, and ultimately increase your average order value through strategic product recommendations.