
- Who Can Access Amazon Brand Analytics Reports?
- How to Access Amazon Brand Analytics Dashboard
- Complete Guide to All Amazon Brand Analytics Reports
- Snapshot
- Sales Diagnostics Report
- Sales Performance Trends
- Geographic Sales Insights
- Net PPM
- Pre-orders
- Traffic Diagnosis
- Real-time sales
- Forecasting and Inventory Planning
- Inventory condition
- Amazon Search Terms
- Repeat purchase behavior
- Market basket analysis
- Item comparison and alternative purchase behavior
- Customer reviews
- How to Export Amazon Brand Analytics Data
- Conclusion
Amazon Brand Analytics (ABA) is Amazon's most powerful free analytics platform, providing brand owners with exclusive access to 15+ detailed reports covering sales performance, customer behavior, and competitive intelligence. Previously known as Amazon Retail Analytics Premium (ARAP), this comprehensive tool enables sellers and vendors to make data-driven decisions by monitoring business performance, identifying trends, and understanding customer purchasing patterns.
You can find answers to questions such as:
- What are the sales for your products in a certain period or day? (Sales Diagnostic Report)
- What is the customer behavior before, during and after a purchase on Amazon? (Item comparison and alternate report) *In which state are sales for your product highest? (Geographic Sales Insights)
- Are your marketing campaigns actually impacting your sales? (Repeat purchase behavior report)
Who Can Access Amazon Brand Analytics Reports?
In general, all Amazon sellers and vendors can access the reports as long as they are also brand owners. To do so, you must have registered your brand with the Amazon Brand Registry (Brand Registry).
How to Access Amazon Brand Analytics Dashboard
To access the reports, you must first log in to Vendor or Seller Central. For example, Vendors click on Reports and then select the Analytics sub-item. You will then be taken to the Brand Analytics overview page, where you can select the different reports.
Complete Guide to All Amazon Brand Analytics Reports
Snapshot
When you open the report page, the Snapshot is always displayed at the beginning.
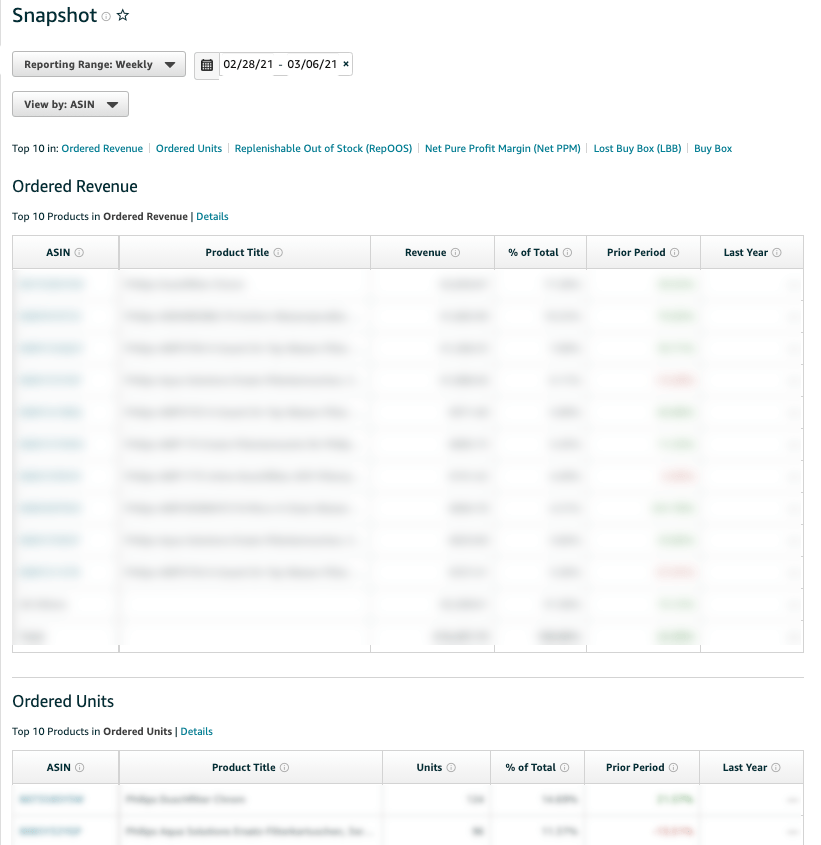
The Snapshot page is a summary of other reports. Among other things, you can see there the top 10 products by revenue and sales, the top 10 products that were out of stock even though they were reordered, the products with the highest margin (from Amazon's point of view), and the products where Amazon lost the buybox most often.
Sales Diagnostics Report
The Sales Diagnostics report allows you to track revenue, sales, as well as other metrics of your ASINs. It will show you metrics such as Ordered Revnue, Ordered Units, Average Sales Price, Glance Views, Conversion Rate, RepOOS, and Lost Buy Box Price (LBB). Often Amazon shows the current value as well as the value from the previous period.
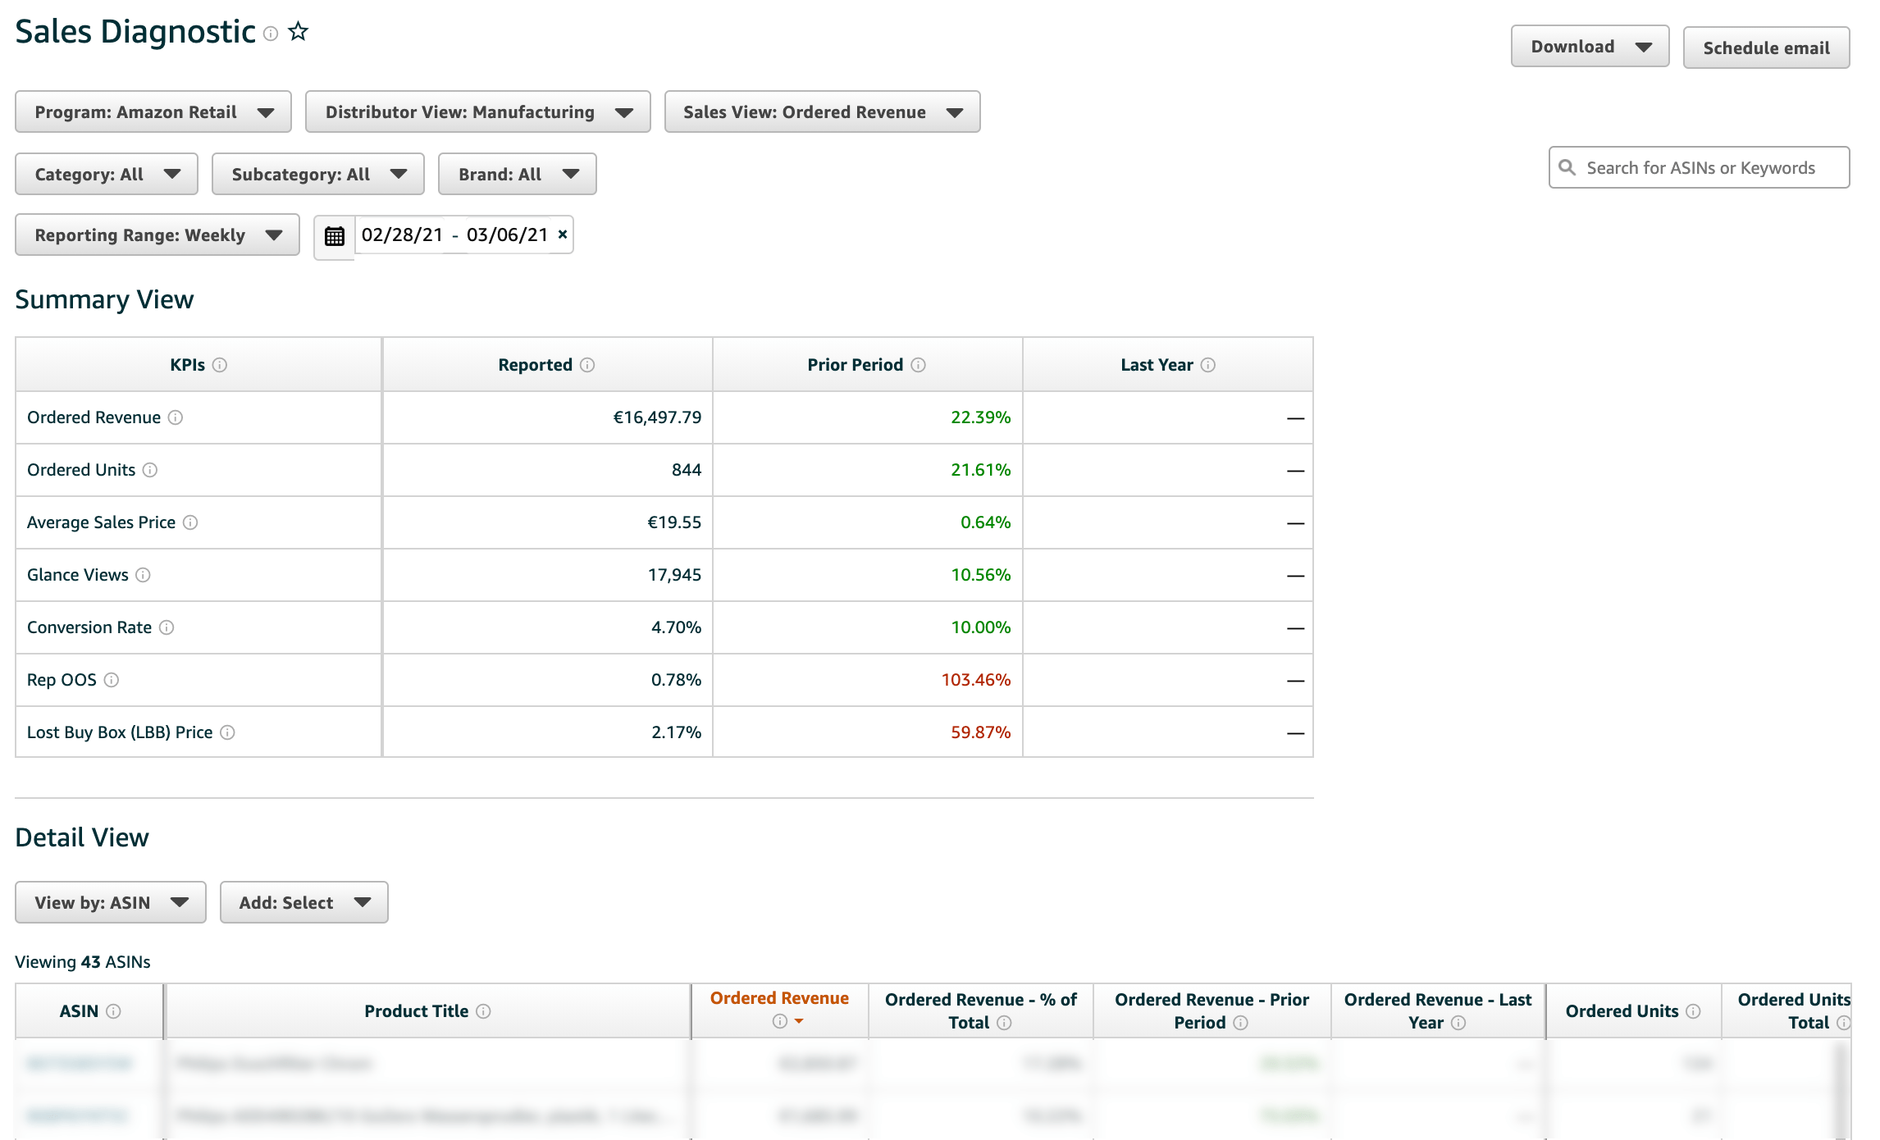
The results can be grouped by ASIN, main category or subcategory. In addition, there are different views that can be selected by choosing Distributor View or Sales View.
The Sales Diagnostics report is certainly one of the most important reports from Brand Analytics. More on this later in a separate article on this report.
The Sales Diagnostics Report explained in detail
More informations about the report you can find here: click here →
Sales Performance Trends
This report is similar to the Sales Diagnostics report, but presents the data over time.
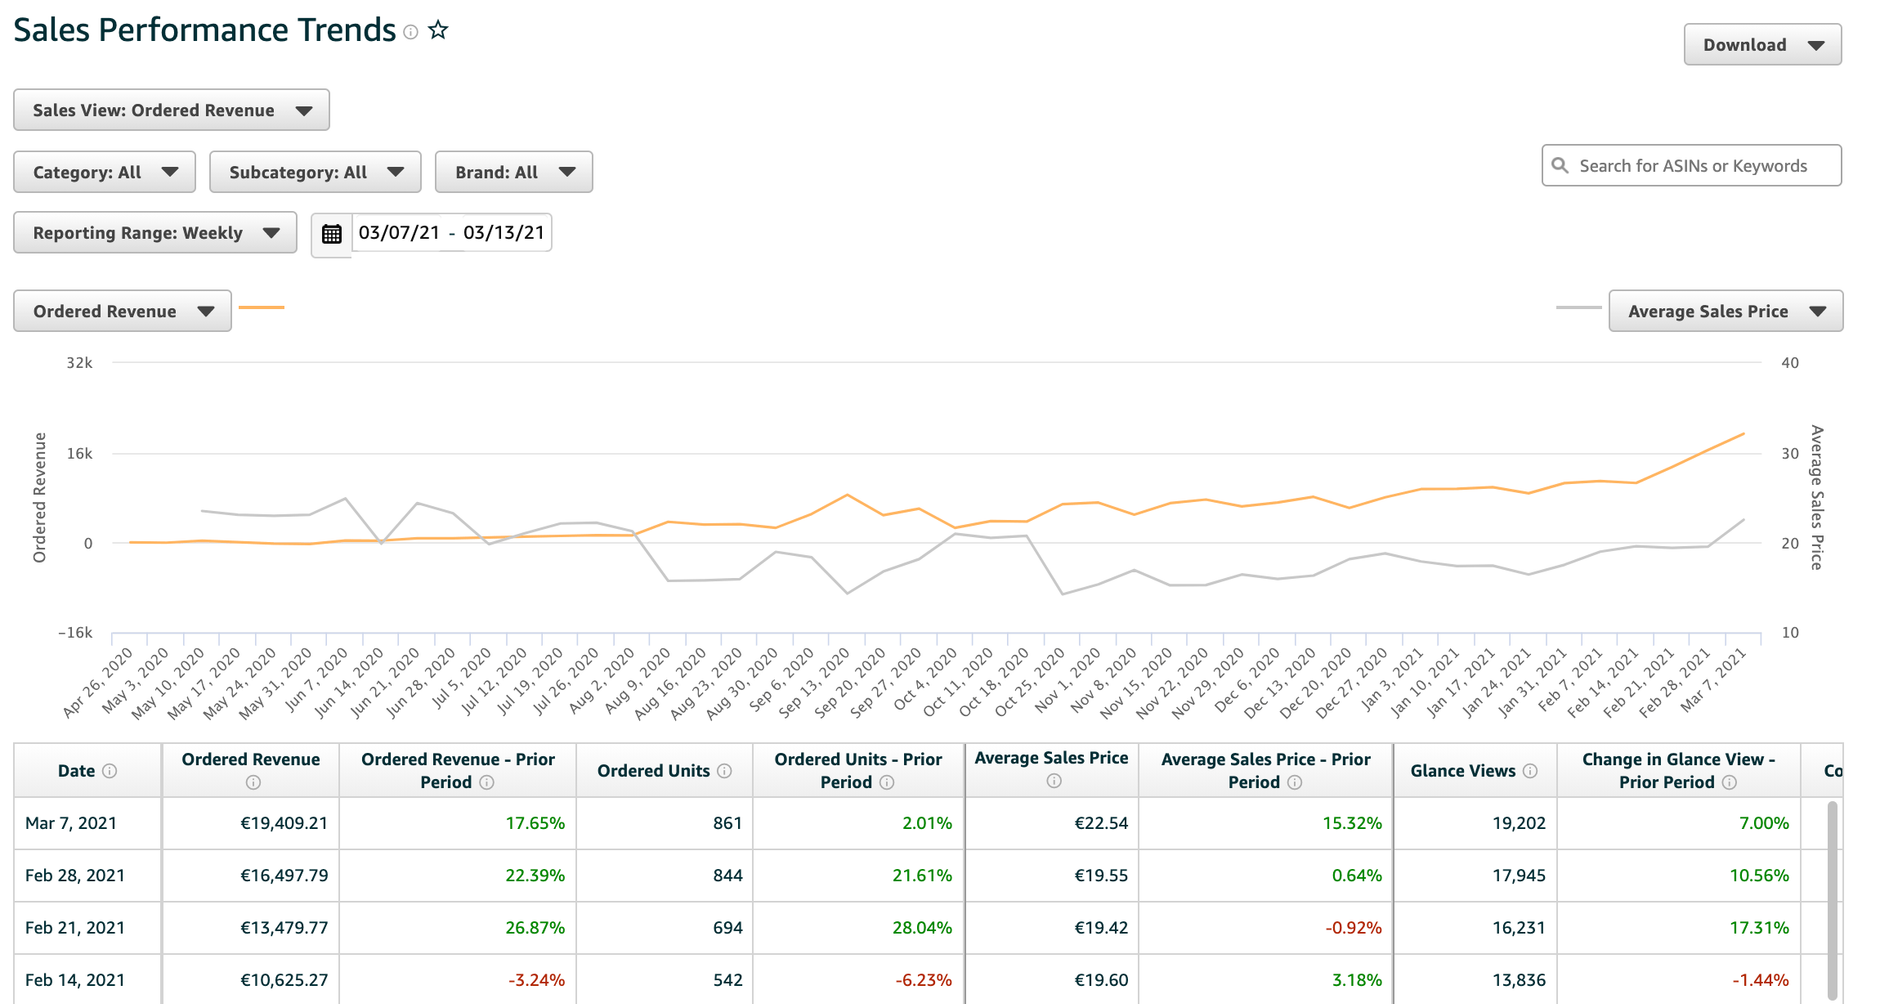
In the graphical representation you can select two time freedoms:
Time line 1:
- Units shipped
- Value of units shipped
Time line 2:
- Average sales price
- Change in page views - previous period
- Conversion change - previous period
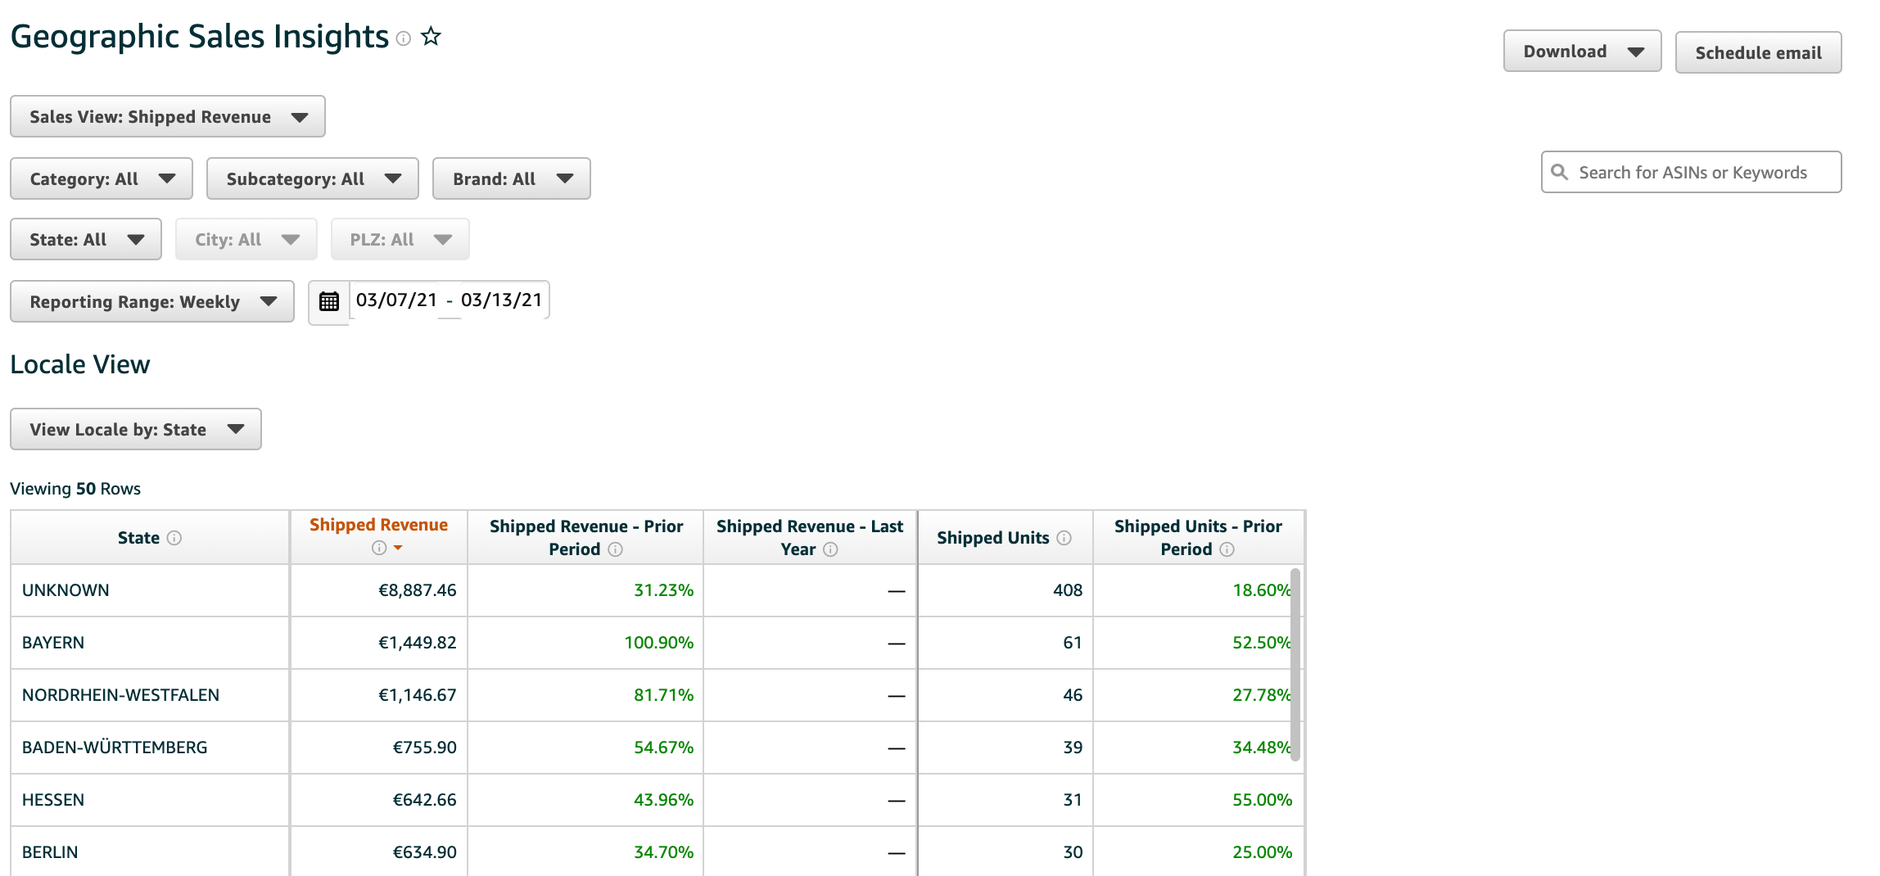
Geographic Sales Insights
If you want to identify which areas are growing or declining in sales and what trends are emerging, then you should take a look at this report. In doing so, you have the additional option of selecting geographic areas and filtering your data geographically.
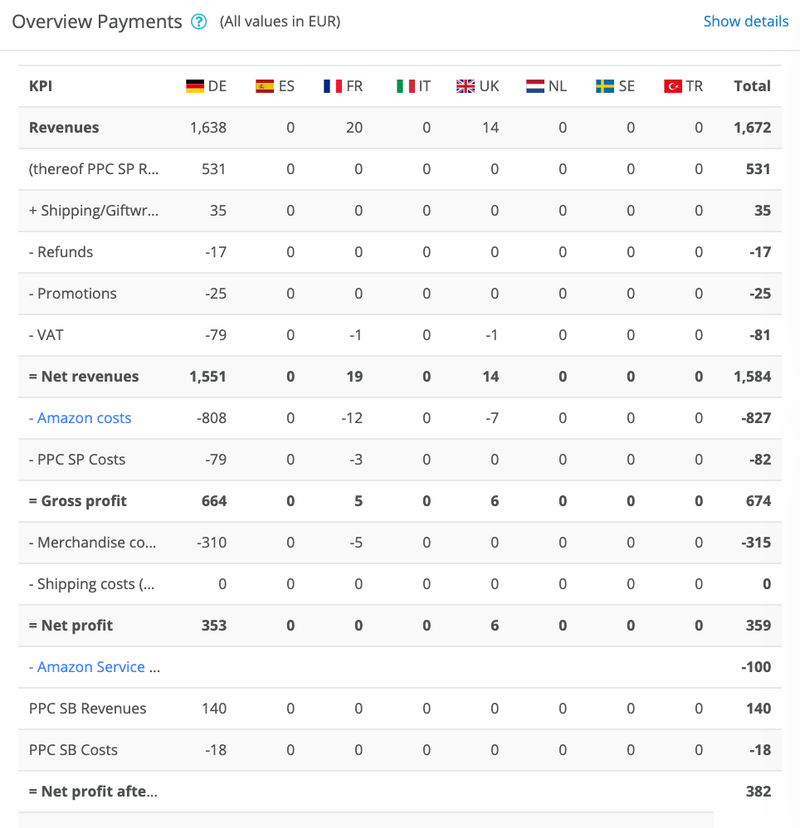
Net PPM
Find out which products contribute to your brand's profitability in the Netto PPM report.
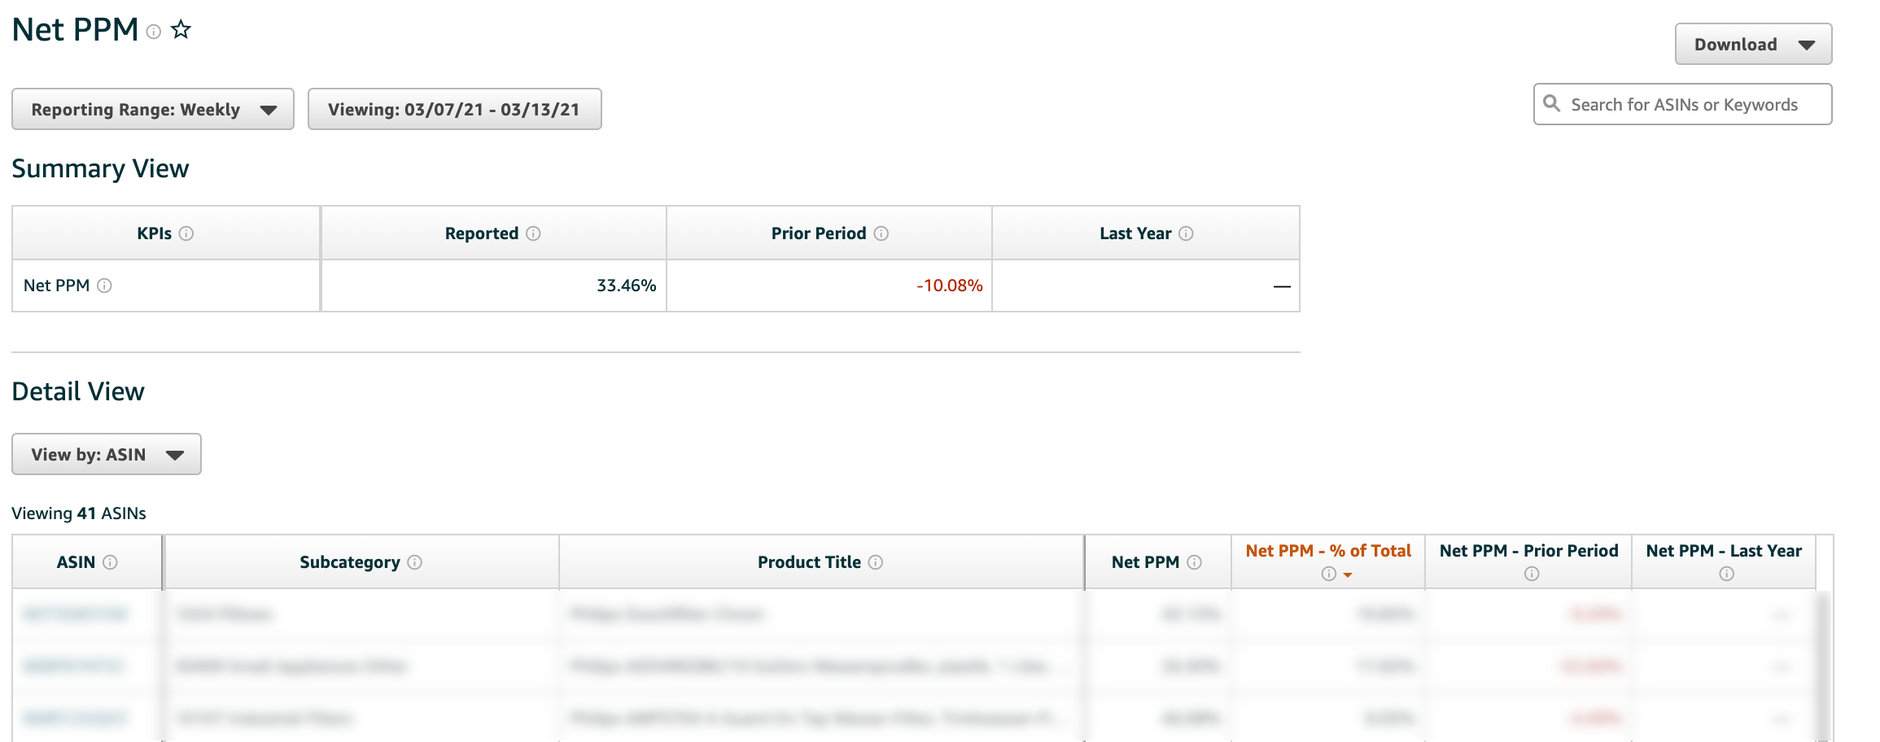
Amazon describes the Netto PPM metric as follows:
Net profit of the product after deducting the cost of goods sold and the various agreed services such as flat-rate returns. Sales discounts are not taken into account.
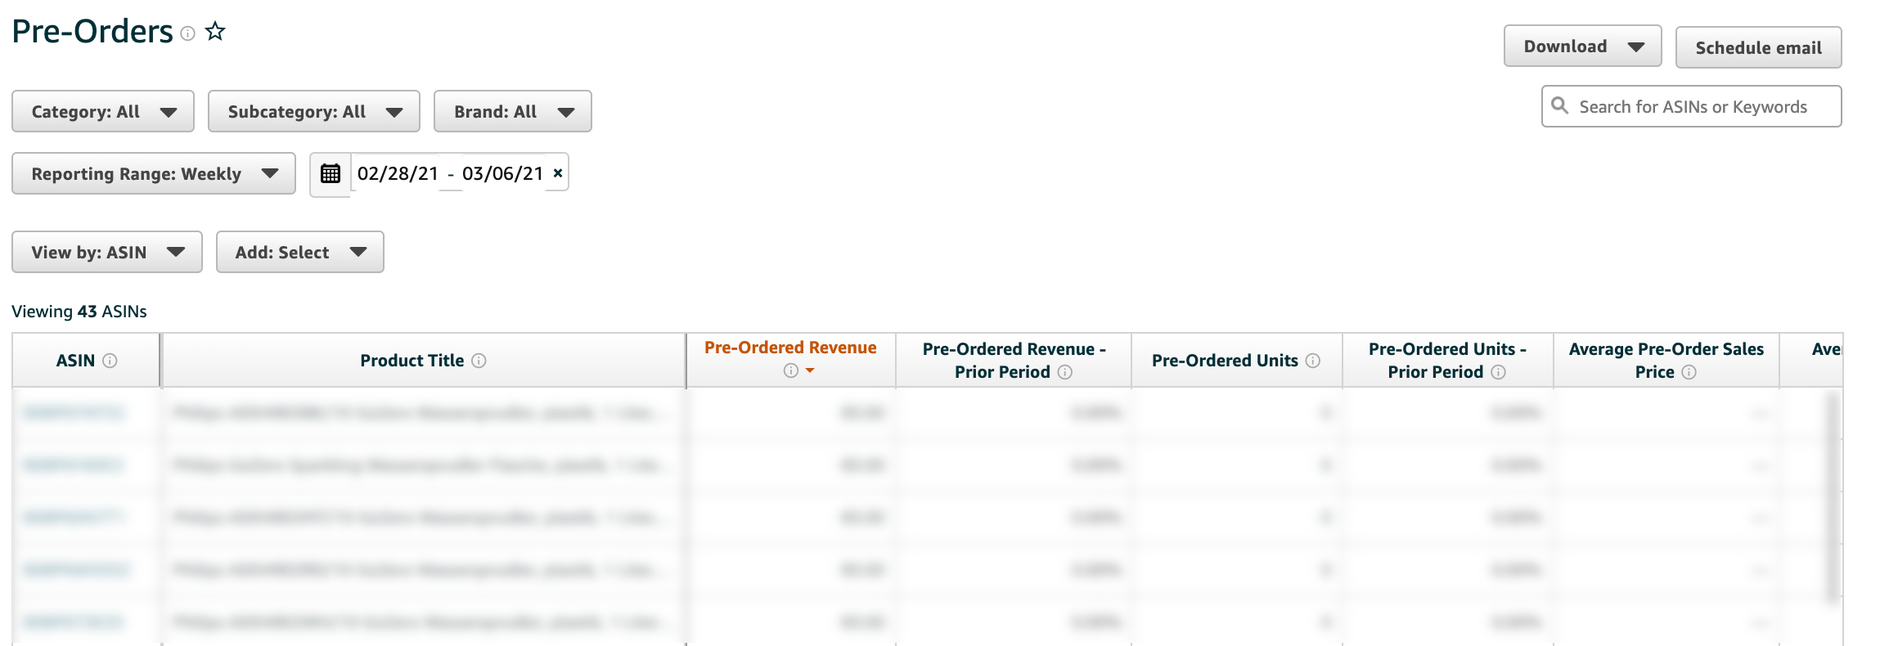
Pre-orders
The pre-orders report is used to effectively manage new product releases by closely monitoring pre-order performance.
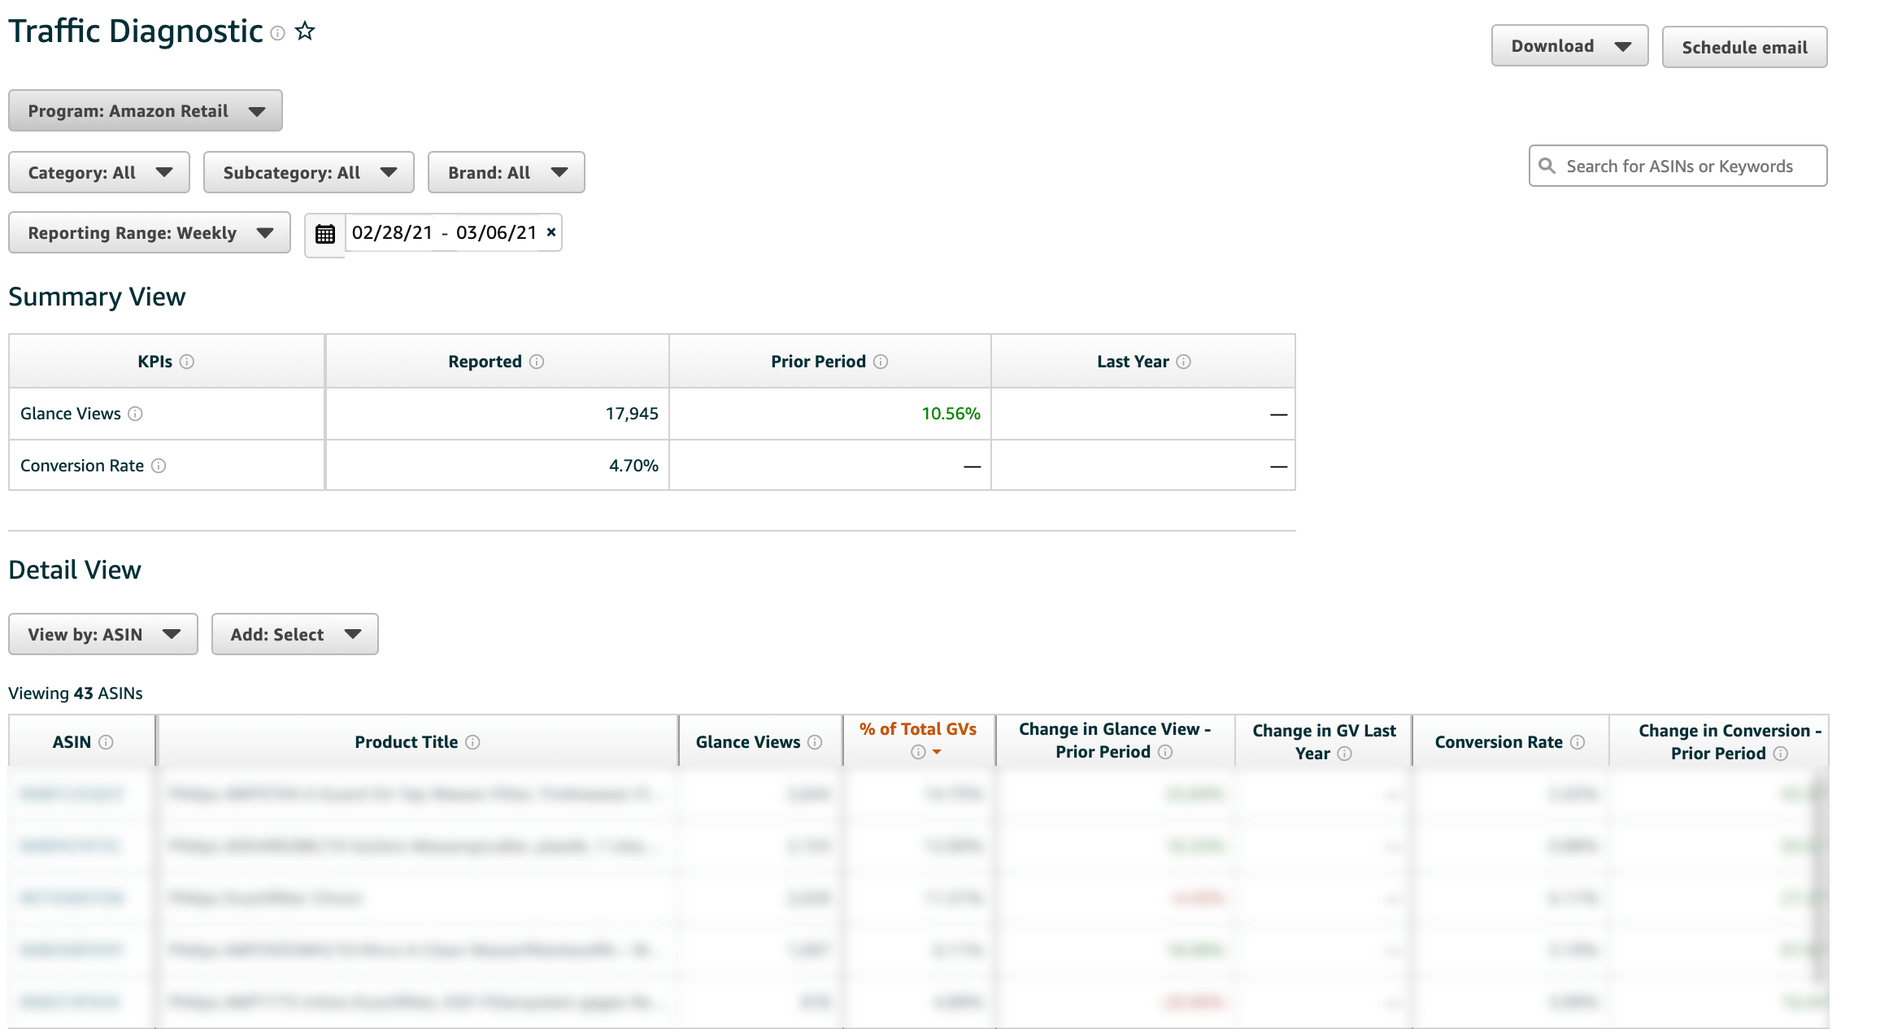
Traffic Diagnosis
The Traffic Diagnostics report is useful for monitoring the development of your traffic. It presents 3 important metrics at the product, category or subcategory level: Changes in the
- Number of page views and the change from the previous period and the previous year
- Number of conversions and the change from the previous period and the previous year.
- Number of page views and the change from the previous period and the previous year.
With the help of this report, you can try to determine whether actions on your part lead to higher visibility or better conversion rate. The conversion rate will also help you, for example, when setting up marketing campaigns to determine your maximum CPC, as this is significantly influenced by the conversion rate.
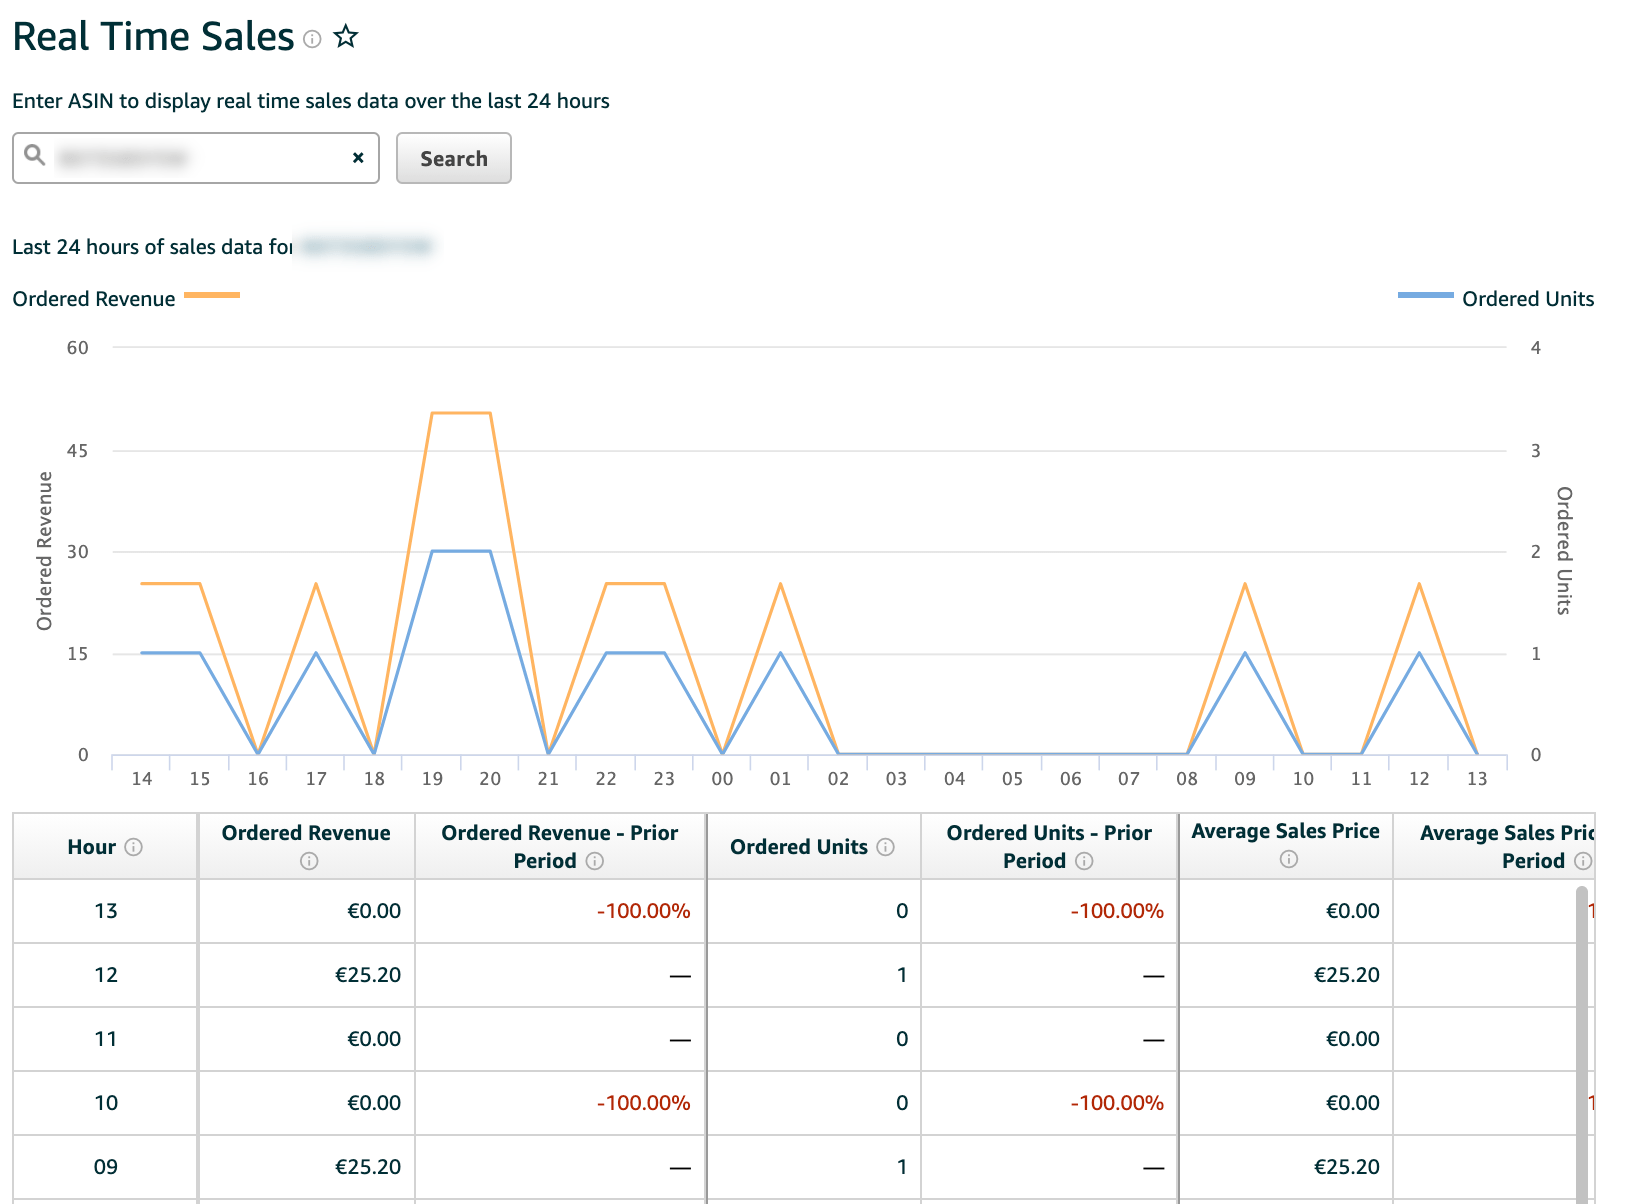
Real-time sales
Enter your ASIN of a product to view real-time sales data for the last 24 hours.
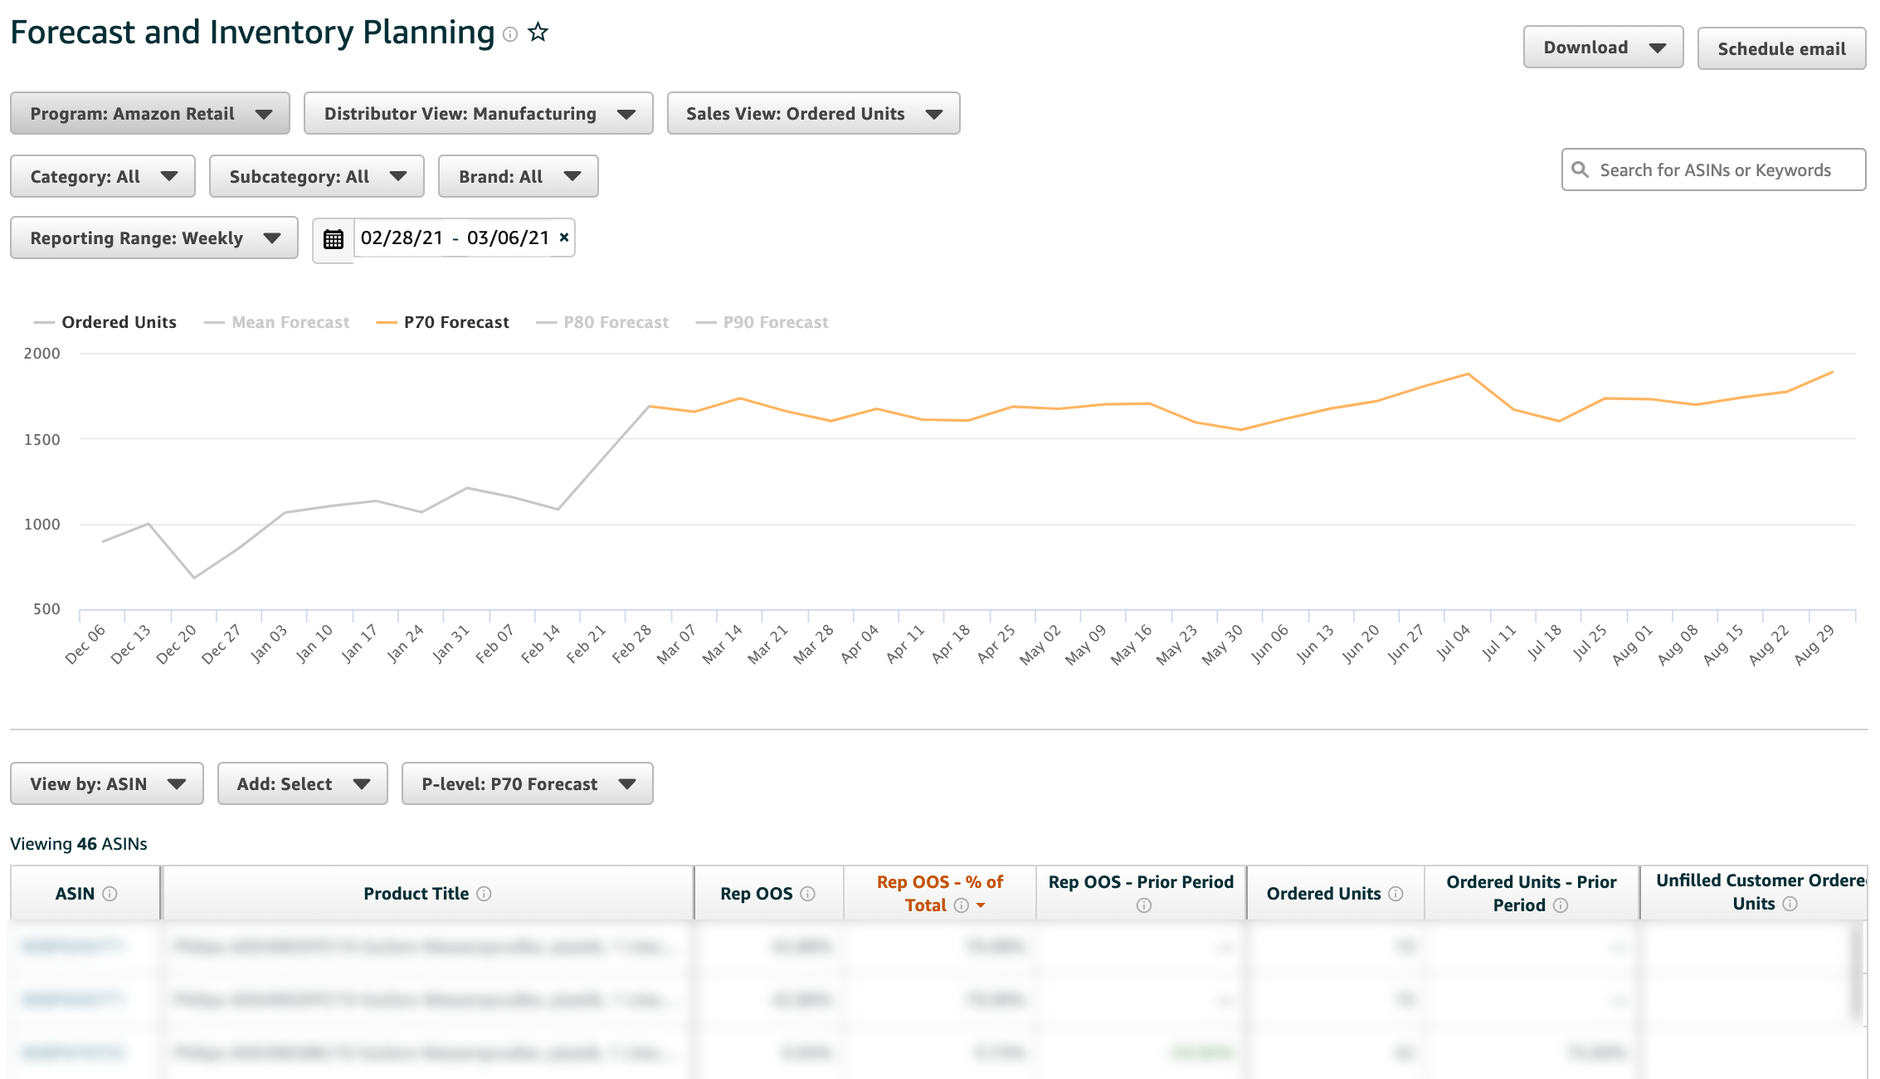
Forecasting and Inventory Planning
This report is used for supply chain planning to minimize the risk of inventory shortages. It shows you inventory with depleted stock so you can get an estimate of how much you need to produce to meet the demand of your product.
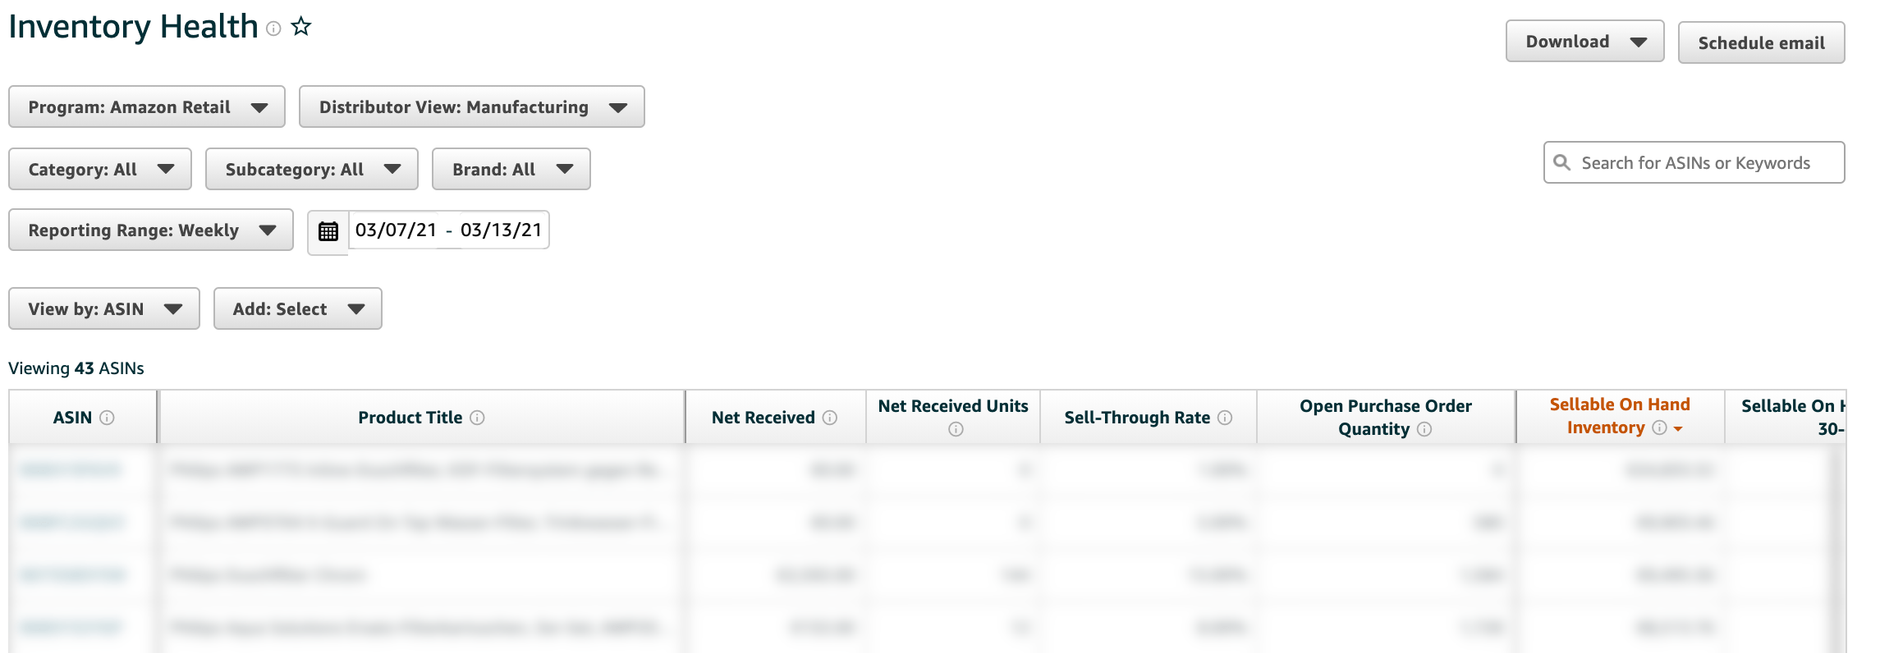
Inventory condition
As the name of the report suggests, it helps you to monitor your inventory on Amazon. In the process, stock updates are injected on a weekly basis. Important metrics provided here include Inventory marketable stock and Saleable stock older than 90 days.
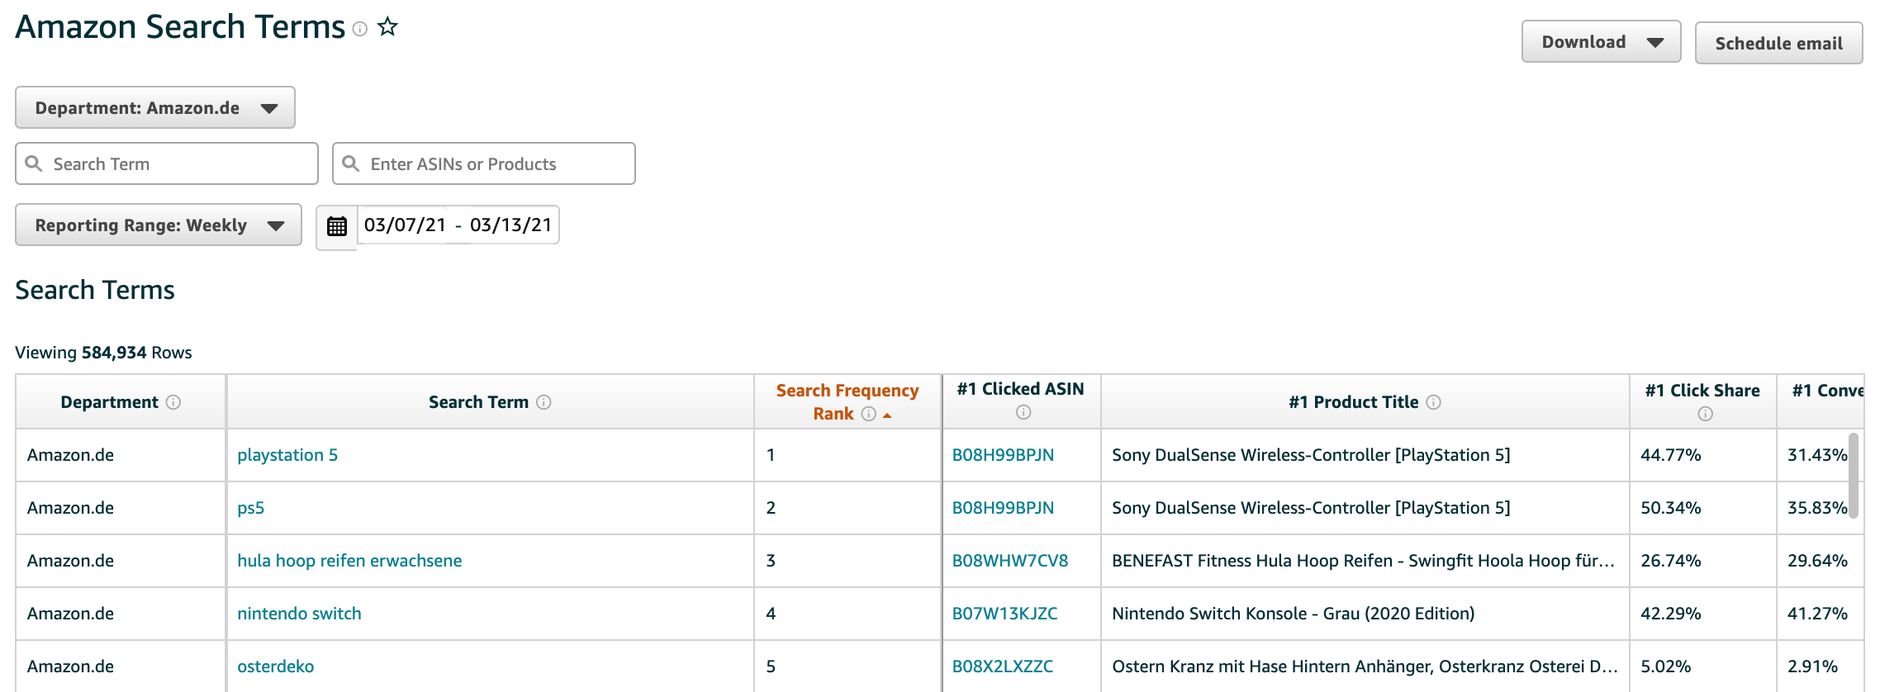
Amazon Search Terms
Using the Amazon Search Terms report, you can identify the most important search terms for your business and use them to optimize your text content. The report shows the most important search terms overall or at the category level. Based on the search frequency rank, the top search terms on Amazon can be sorted by number of searches for a specific time period. The search terms can thus be better evaluated for campaign and product optimization, for example. Overall, you can see the three most clicked products per search term and its click and conversion rate.
The Amazon Search Terms Report explained in detail
More informations about the report you can find here: click here →
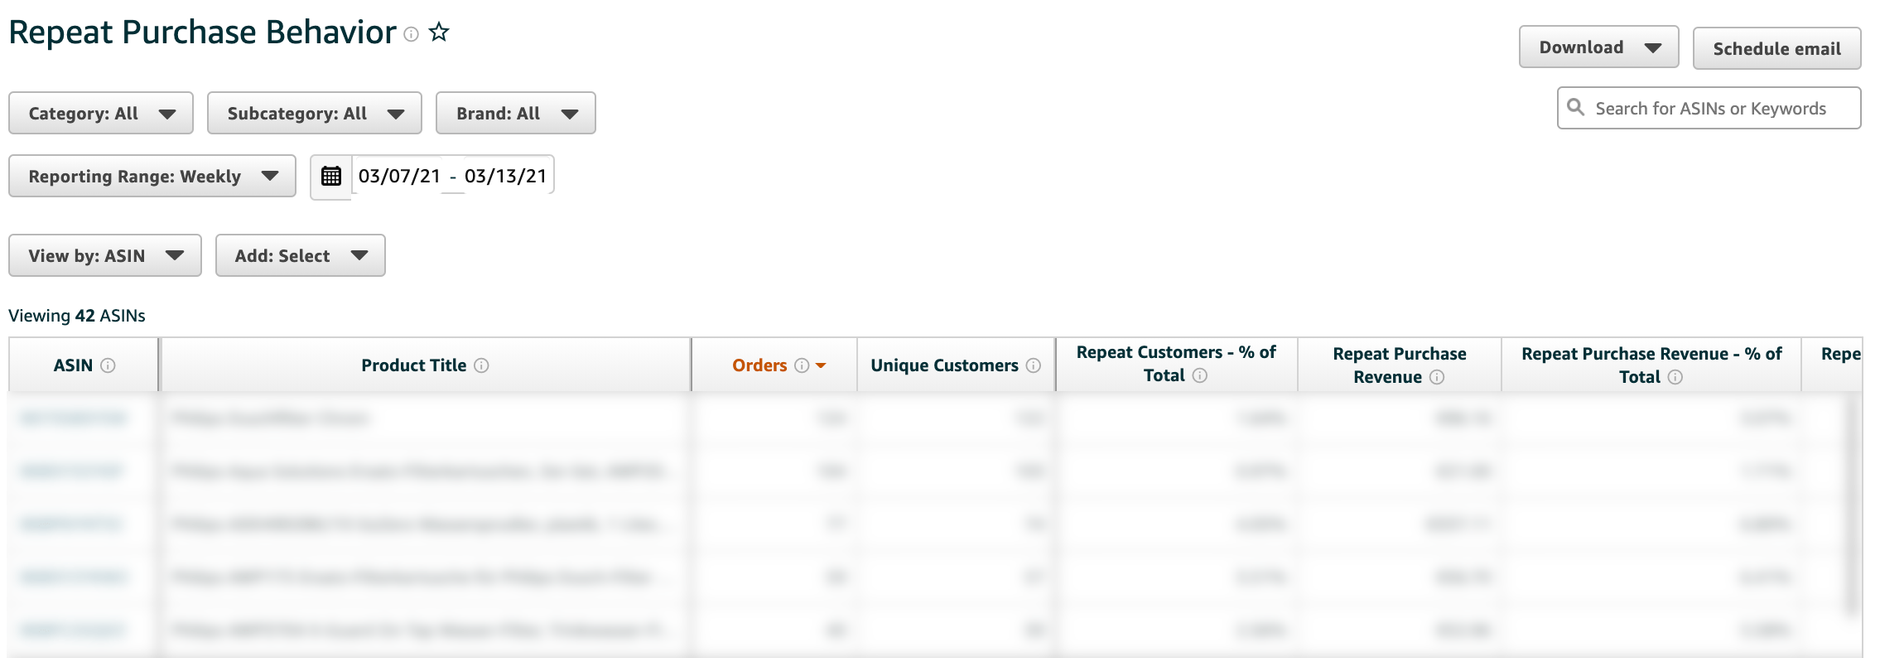
Repeat purchase behavior
The report shows you how many orders have been received for each of your products or brands and indicates the number of unique customers who placed the orders. By matching the order numbers with the number of unique customers, you can identify products and brands that have been ordered multiple times by the same customer within the specified time period.
This also helps when planning marketing campaigns: products with a high repurchase rate allow you to invest more in PPC campaigns than if the very first purchase has to be profitable.
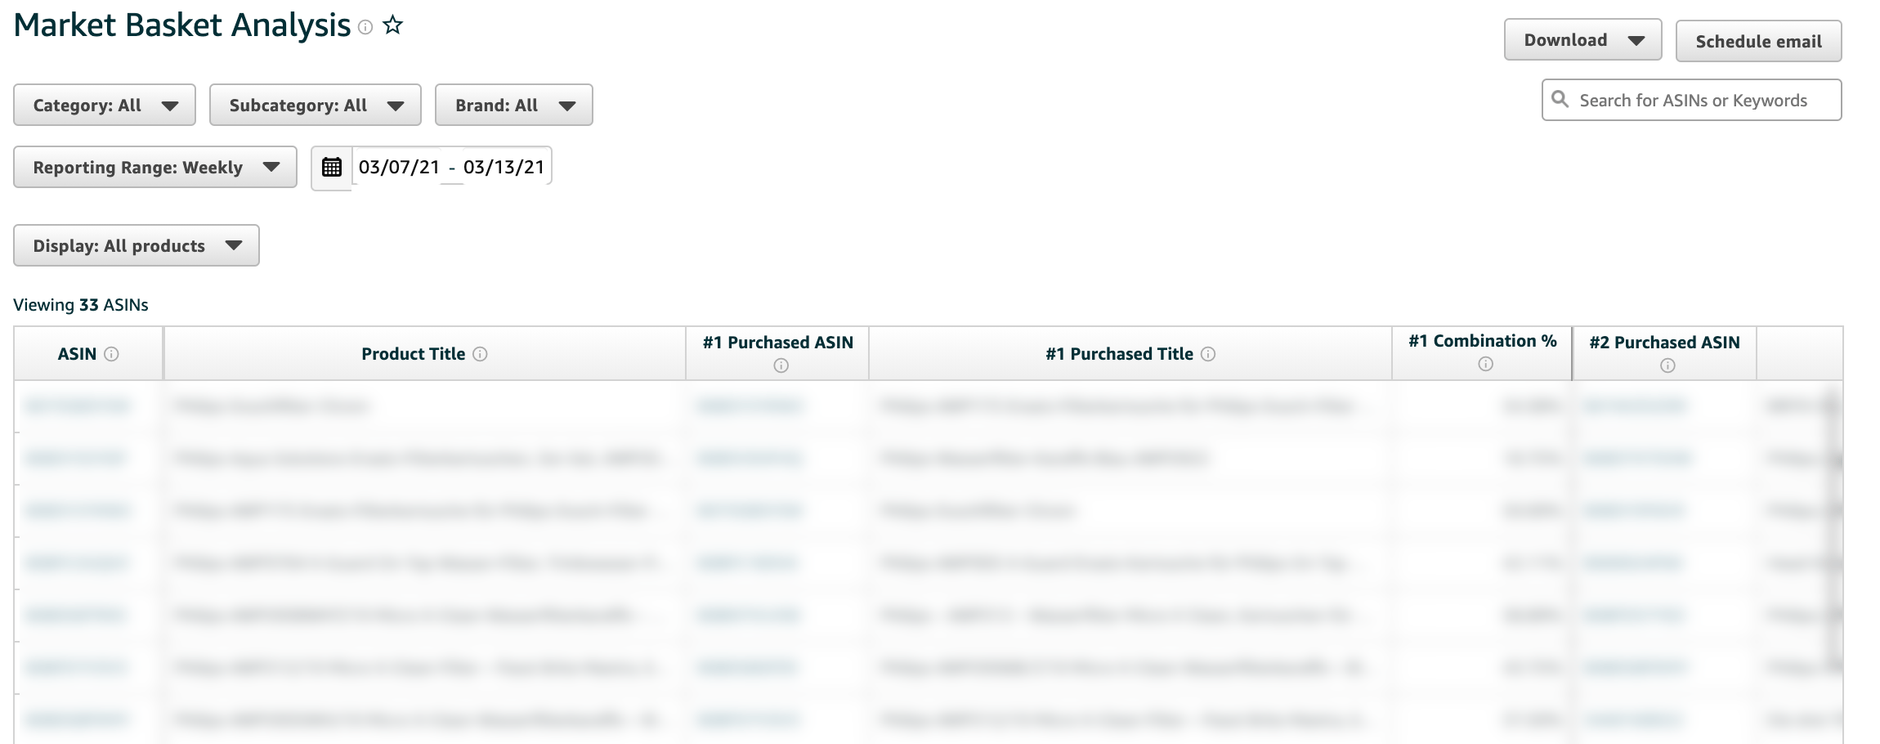
Market basket analysis
Determine which products are most frequently purchased together with your products. This allows you to identify opportunities for product combinations, cross-selling or product range extensions.
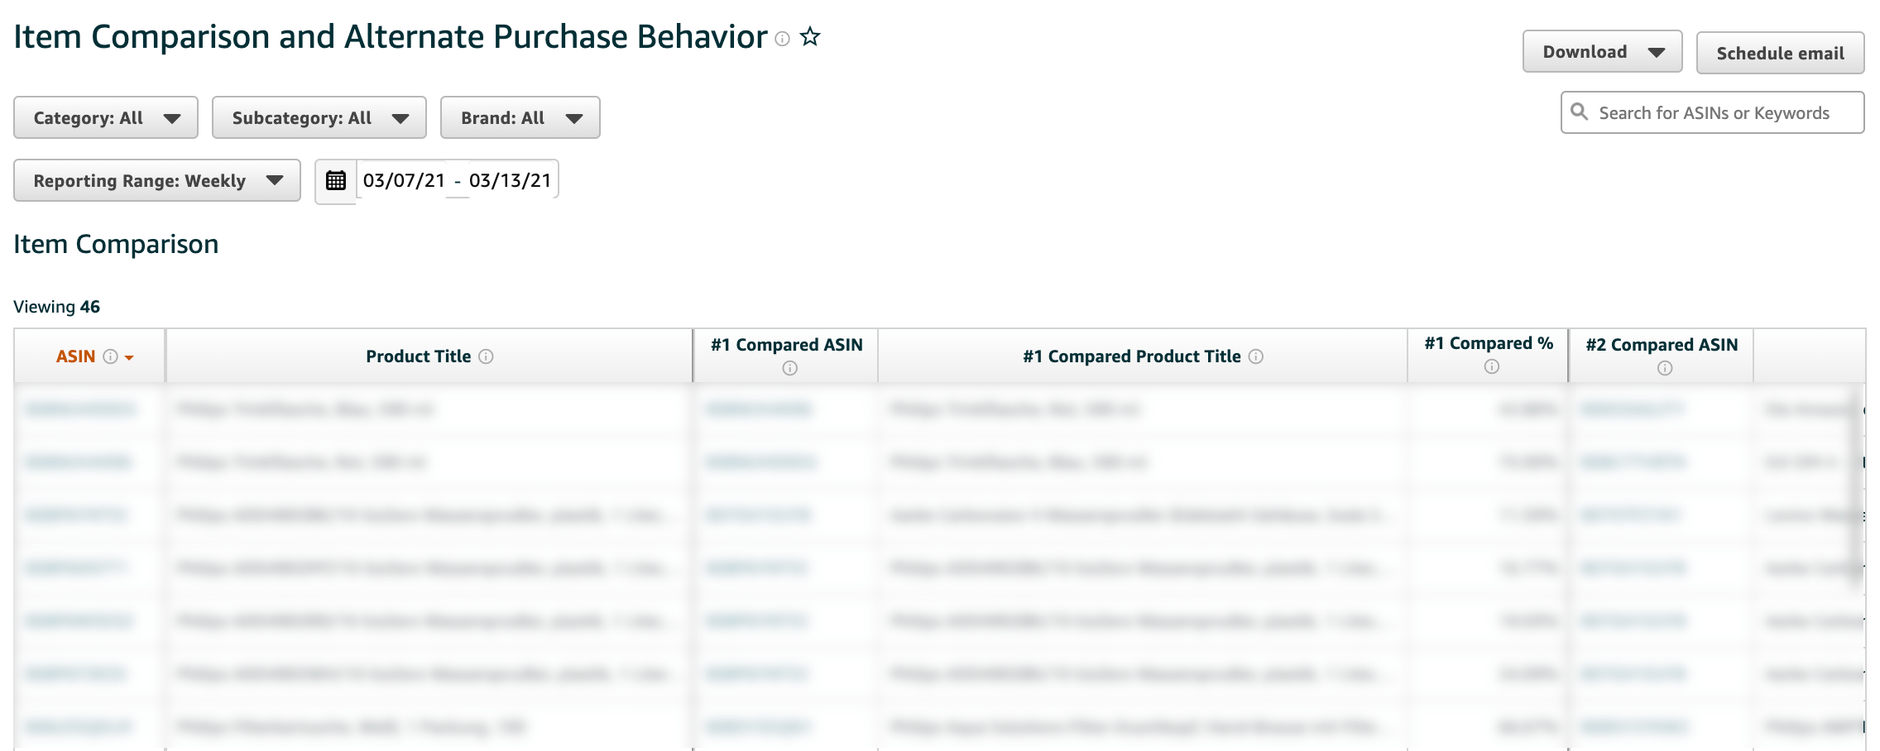
Item comparison and alternative purchase behavior
Which products do consumers compare before they buy? Which products do consumers buy instead of your product? The Article Comparison and Alternative Purchase Behavior report provides you with these answers. Identify product differentiators based on the most viewed/purchased products and develop targeted product campaigns based on the most viewed/purchased products.
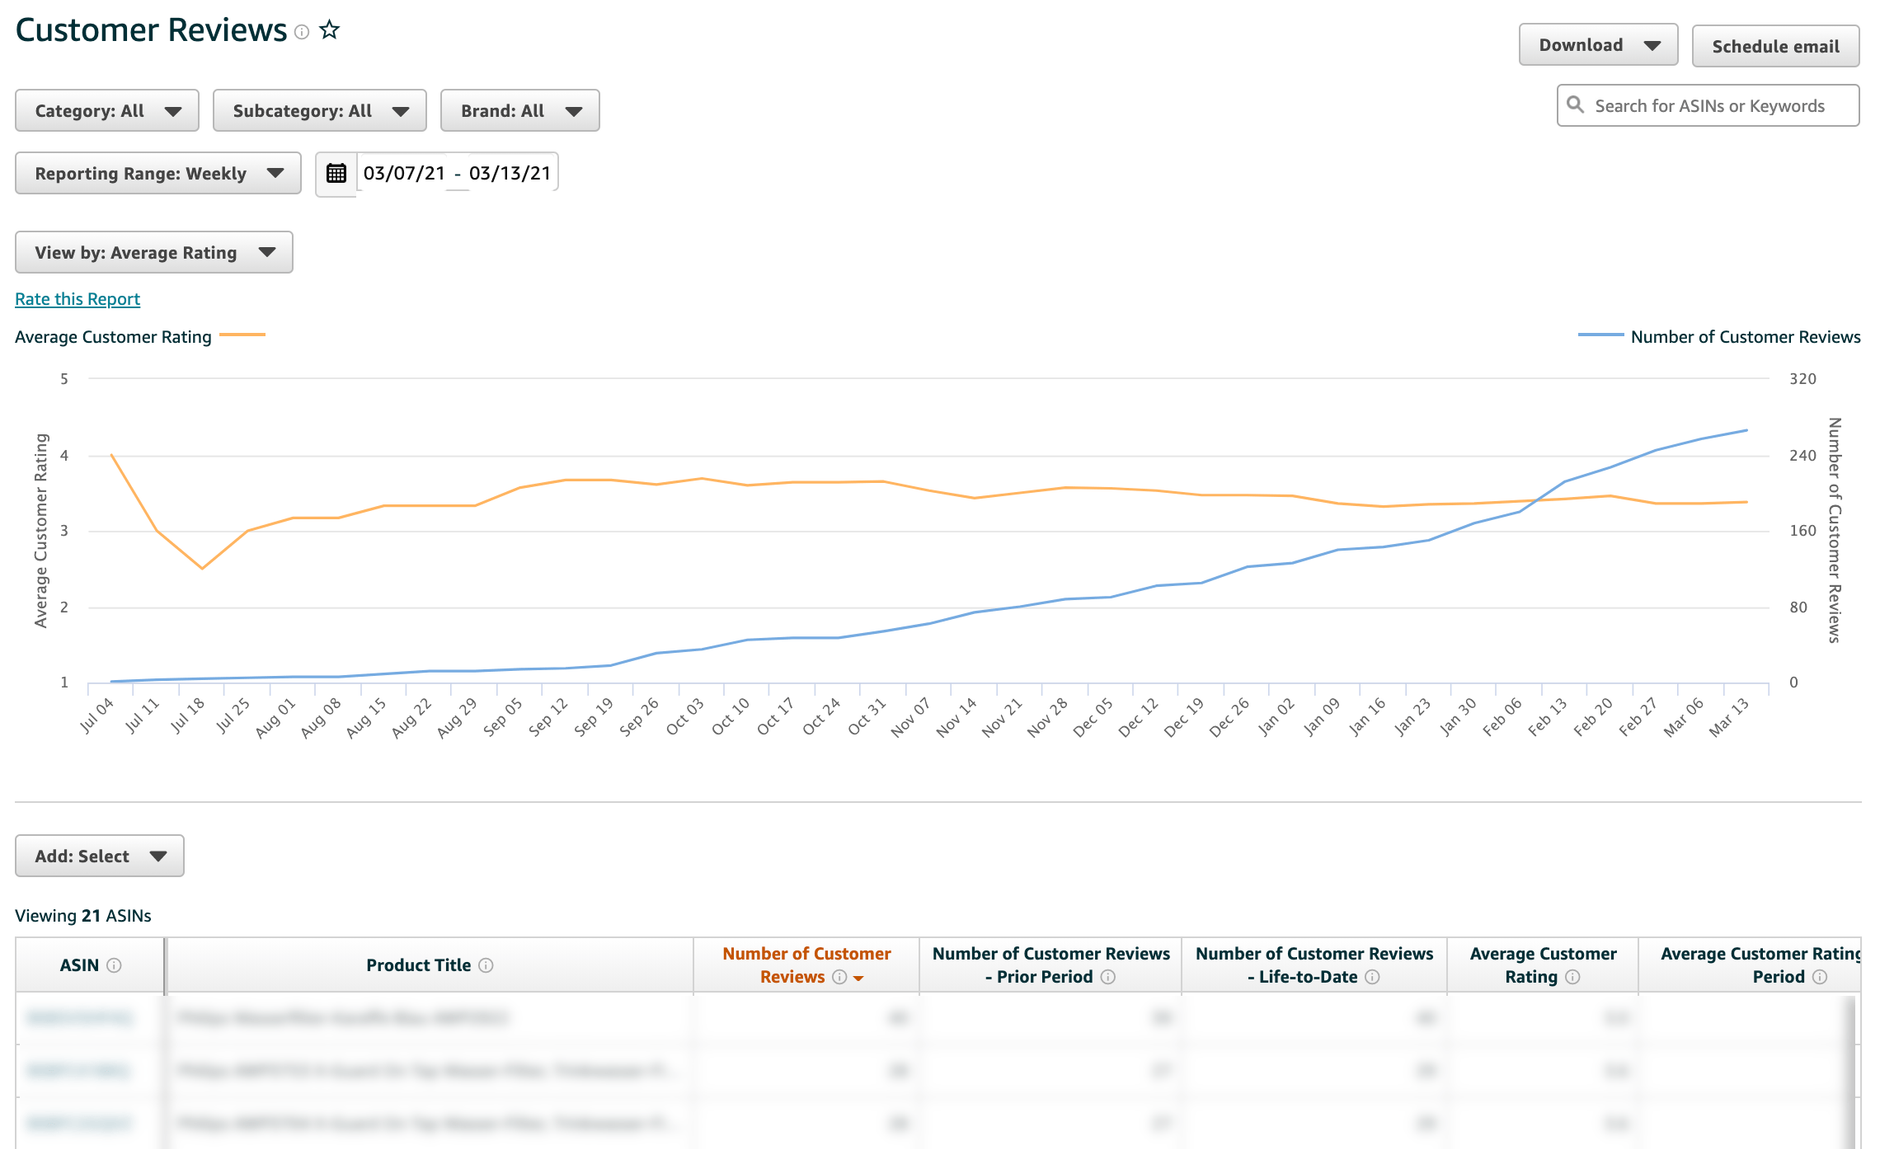
Customer reviews
Monitor customer ratings and reviews with this report. Among other things, the report shows you the number of customer reviews and the average customer rating. Important: You will not see the number of star ratings here, only the reviews.
AMALYTIX also helps you to monitor your reviews. With AMALYTIX, you will have a closer look at your reviews and see not only individual numbers, but also the review texts. With the help of the information AMALYTIX provides you with, you get the necessary knowledge to e.g..
- Explain sales changes (both positive and negative),
- implement product improvements,
- add missing or important information to listings that customers often misunderstand,
- comment on negative reviews in a timely manner to find a solution with the buyer and turn a negative review into a less critical one.
How to Export Amazon Brand Analytics Data
In general, you can generate data on a daily, weekly, monthly or even quarterly basis. The export of this data works either via a direct export as an Excel workbook or a CSV file. The report can also be generated on a regular basis, e.g. weekly. One then receives an email when the report has been generated. This can then be downloaded. The report itself does not come as an attachment.
Conclusion
Amazon Brand Analytics provides sellers and vendors with unparalleled insights into their business performance and customer behavior. By mastering all 15 ABA reports—from the Sales Diagnostic Report to the Search Terms Report and Market Basket Analysis—you can make data-driven decisions that drive growth. Regular analysis of these reports is essential for maintaining competitive advantage in the Amazon marketplace.